Why is investing important?
Investing is important for several reasons:
- Building wealth: Investing is a powerful tool for building wealth over time. It allows you to take advantage of the power of compound interest, where the interest earned on an investment is reinvested and earns interest on itself, leading to exponential growth over time.
- Preparing for retirement: Investing is crucial for preparing for retirement. Investing in long-term investments such as stocks, bonds, and real estate can provide a steady stream of income during retirement, and help to ensure a comfortable lifestyle.
- Inflation protection: Investing can help to protect against inflation, which erodes the value of cash over time. Investing in assets that have the potential to appreciate in value, such as stocks and real estate, can help to preserve purchasing power.
- Diversification: Investing allows you to diversify your portfolio and spread risk across different types of assets and industries. This can help to protect against market fluctuations and reduce the overall risk of your investments.
- Financial literacy: Investing helps people to understand the basics of financial markets and how money works. It also teaches people how to make informed decisions and manage their money effectively.
A long-term investment is an investment that is held for a significant period of time, usually several years or more. This type of investment is typically made with the expectation of earning a return over an extended period, rather than seeking short-term gains. Long-term investments can include stocks, bonds, real estate, and other assets that are expected to appreciate in value over time. These investments often have more risk than short-term investments, but they also have the potential for higher returns. The goal of long-term investing is to buy assets at a lower price and hold them until they appreciate in value, thus resulting in a profit when they are sold. Additionally, long-term investments can also provide a steady stream of income, such as dividends or rental income.
What is Options Trading?
Options trading is a financial activity where investors buy or sell contracts that give them the right, but not the obligation, to buy or sell an underlying asset at a specific price on or before a specific date. These contracts are called options. Options traders use various strategies to try and profit from these contracts, such as buying call options (the right to buy an asset) or put options (the right to sell an asset) and using combinations of options, such as spreads and straddles. Options trading is considered to be a more advanced form of investing and carries a higher level of risk.
Options trading is a financial activity where investors buy or sell contracts that give them the right, but not the obligation, to buy or sell an underlying asset at a specific price on or before a specific date. These contracts are called options. Options traders use various strategies to try and profit from these contracts, such as buying call options (the right to buy an asset) or put options (the right to sell an asset) and using combinations of options, such as spreads and straddles. Options trading is considered to be a more advanced form of investing and carries a higher level of risk.
Options trading is a type of investment that allows an investor to buy or sell the right, but not the obligation, to buy or sell an underlying asset at a specific price on or before a certain date. This is known as the strike price. An option that gives the holder the right to buy an underlying asset is called a call option, while an option that gives the holder the right to sell an underlying asset is called a put option.
Options trading can be used for a variety of purposes, such as hedging risk, generating income, and speculating on the price movements of an underlying asset.
For example, an investor may use options trading to hedge against the risk of a stock market crash by buying put options on a stock index. This gives the investor the right to sell their stocks at a specific price, even if the market crashes and the stock value falls.
Options trading can also be used to generate income. An investor can sell call options on a stock they own, which gives the buyer of the option the right to purchase the stock at a specific price. If the stock price rises above the strike price, the buyer of the option will exercise their right to buy the stock, and the seller of the option will make a profit.
Another popular use of options trading is for speculating on the price movements of an underlying asset. An investor can buy call options on a stock they believe will increase in value, or sell put options on a stock they believe will decrease in value. If the stock price moves in the direction the investor predicts, they will make a profit.
Options trading can be a complex and risky investment, and it is important to understand the mechanics and risks involved before getting started. One important concept in options trading is the concept of time decay. The value of an option decreases as it gets closer to its expiration date. Therefore, options traders must consider the time frame in which they expect the underlying asset's price to move, in order to make the most profitable trades.
Another important concept in options trading is volatility. Volatility refers to the degree to which the price of an underlying asset fluctuates. Options contracts with high volatility are more expensive because they have a higher potential for large price movements.
Options trading also involves the use of leverage. Leverage is the ability to control a large amount of an underlying asset with a relatively small amount of capital. This can magnify potential profits, but it also increases the potential for losses.
Options trading also involves several different types of orders, such as market orders, limit orders, and stop-loss orders. A market order is an order to buy or sell an option at the current market price. A limit order is an order to buy or sell an option at a specific price or better. A stop-loss order is an order to sell an option when it reaches a specific price.
Options trading can also be used in combination with other investment strategies. For example, an investor can use options trading to hedge against the risk of a stock market crash while also generating income by selling call options on a stock they own.
In conclusion, options trading is a type of investment that allows investors to buy or sell the right, but not the obligation, to buy or sell an underlying asset at a specific price on or before a certain date. It can be used for a variety of purposes, such as hedging risk, generating income, and speculating on the price movements of an underlying asset. However, it is important to understand the mechanics and risks involved before getting started, and to always conduct thorough research and analysis before making any trades.
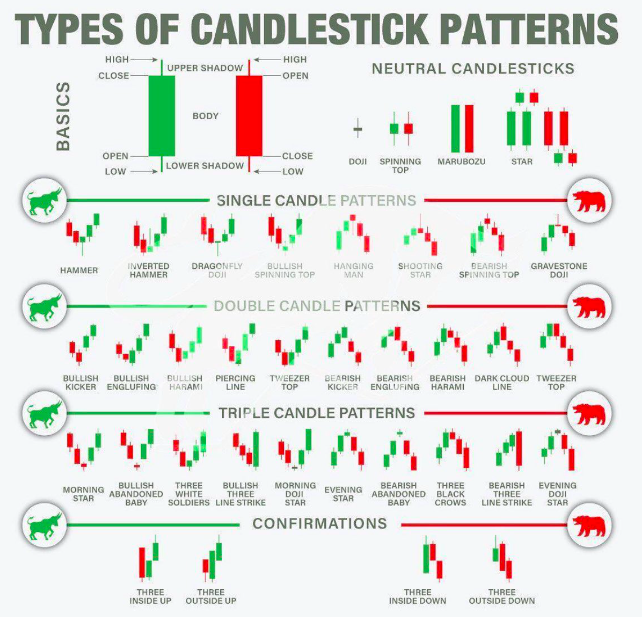
The basics of Candlestick patterns:
A candlestick chart is a type of financial chart that is used to display the price movements of a security, currency, or index. It is a popular charting method among traders and investors, as it provides a clear visual representation of the price action.
The candlestick chart is composed of individual candlesticks, each of which represents a specific time period. The time period can be a day, a week, or a month, depending on the chart being used. Each candlestick is composed of a real body and two shadows, also known as wicks.
The real body of the candlestick represents the range between the opening and closing price of the security during the specified time period. If the closing price is higher than the opening price, the real body is typically white or green, indicating a gain or bullish sentiment. If the closing price is lower than the opening price, the real body is typically black or red, indicating a loss or bearish sentiment.
The upper shadow, also known as the upper wick, represents the highest price reached during the time period. The lower shadow, also known as the lower wick, represents the lowest price reached during the time period.
As you can see in the chart, each candlestick represents one day, and the color of the candlestick indicates whether the stock closed higher or lower than the opening price. The upper and lower shadows represent the highest and lowest prices reached during that day.
There are different types of candlestick patterns that traders and investors use to analyze the market and make trading decisions, such as the bullish reversal patterns like Bullish Harami, Bullish Engulfing and bearish reversal patterns like Bearish Harami, Bearish Engulfing.
Candlestick charting is a powerful tool that can be used to identify trends, support and resistance levels, and potential reversal points. It is important to note that Candlestick charting should be used in conjunction with other technical analysis tools and fundamental analysis to make more informed investment decisions.
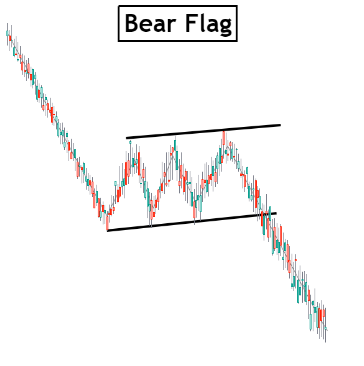
What is a bearflag?
A bear flag is a technical analysis pattern that is used to identify a potential reversal in a downward trend. It is characterized by a sharp downward price movement, followed by a period of consolidation or sideways movement. The consolidation period is usually marked by a series of lower highs and lower lows, and is known as the "flag" portion of the pattern. The bear flag pattern is considered a bearish signal, as it is thought to indicate that the downward trend will continue after the period of consolidation.
The bear flag pattern is formed when the price of an asset drops sharply and then begins to consolidate, forming a flag shape on the chart. The flag shape is formed by a series of lower highs and lower lows, and the slope of the flag should be less steep than the slope of the preceding downward trend. The bear flag pattern is considered complete when the price breaks through the support of the flag, indicating a continuation of the downward trend.
Traders and investors typically use the bear flag pattern in conjunction with other technical analysis tools and indicators, such as trend lines, moving averages, and momentum indicators, to confirm the validity of the pattern and make more informed trading decisions.
It is worth noting that bear flag is a bearish reversal pattern, and traders should wait for the break down of the flag pattern before entering a short position, also as with any other technical analysis pattern, it's important to be aware of other market conditions and fundamentals.